.svg)


How Net & Gross ROI Are Calculated in Dubai Real Estate


A Technical Framework with a Case Study from Al Furjan
Return on Investment (ROI) is the main metric investors use to assess income-producing real estate. In Dubai’s mature and more data-transparent market, ROI analysis is no longer superficial.
Investors now use verified sales and rental data from platforms like DXB Interact. DXB Interact is part of Dubai LandDepartment analytics. This helps investors benchmark asset performance with accuracy.
This article gives a clear breakdown of Gross ROI and Net ROI.
It explains their formulas and cost assumptions. It also shares a real-world case study about one of our clients.
Understanding Gross ROI (Gross Rental Yield)
Gross ROI measures a property’s annual rental income as a percent of its purchase price. It is calculated before operating expenses.
Formula:
Gross RO I= (Annual Rental Income/Acquisition Cost)×100

Where:
- Annual Rental Income = Contracted yearly rent
- Acquisition Cost = Purchase price (optionally including transfer fees & agency fees for more precise modeling)
Gross ROI is primarily a screening metric. It allows investors to compare asset classes and submarkets quickly.
According to Dubai Land Department transaction data reflected on DXB Interact, Al Furjan 1-bedroom apartments typically show gross yields between 7% and 8%, depending on building quality, proximity to Metro, and amenities. This makes Al Furjan competitive with prime districts like Downtown Dubai (5–6%). It also keeps stronger liquidity than newer peripheral areas.
Understanding Net ROI (Net Rental Yield)
Gross ROI does not account for capital expenditure or operational inefficiencies. Therefore, professional investors rely more heavily on Net ROI, which deducts recurring costs.
Formula:
Net ROI=(Annual Rental Income−Operating Expenses Acquisition/ Cost)×100
Operating expenses typically include:
- Service charges (AED/sq.ft basis)
- Property management fees (5–8%)
- Preventive & corrective maintenance
- Vacancy allowance (5–10%)
- Insurance
- Utilities (if landlord-paid)
Net ROI provides a truer measure of cash-on-cash efficiency before financing considerations.
Case Study: Mr. Nilesh - 1 Bedroom in Al Furjan
Asset Details
- Location: Al Furjan, Dubai
- Configuration: 1 Bedroom Apartment
- Purchase Price: AED 1,100,000
- Estimated Size: ~750–820 sq.ft
- Ownership Type: Freehold
Market Rental Benchmark
Based on DLD rental contract data on DXB Interact, 1-bedroom apartments in Al Furjan rent for AED 80,000 to AED 90,000 per year. The exact rent depends on furnishing status and tower grade.
For conservative modeling, we assume:
Annual Rent = AED 85,000
Step 1: Calculate Gross ROI
Gross ROI=(85,0001,100,000)×1000
=7.73%

Interpretation:
Mr. Nilesh’s asset generates a 7.73% topline rental return before costs — aligning with upper-quartile Al Furjan performance.
Step 2: Model Operating Expenses
Let us assume the following realistic cost structure:
1. Service Charges
Al Furjan service charges average approximately AED 14–16 per sq.ft depending on building quality.
Assuming 780 sq.ft at AED 15:
780×15= AED11,7002.
2. Property Management (8%)
85,000×0.08= AED6,8003.
3. Maintenance Provision
Industry norm: 3–5% of rent
Assume 5%:
85,000×0.05= AED4,2504.
4. Vacancy Allowance (5%)
85,000×0.05 =AED4,250
Total Operating Expenses:
11,700+6,800+4,250+4,250 = AED27,000
Step 3: Calculate Net ROI
Net Income:
85,000−27,000 = AED58,000
Net ROI=(58,000/1,100,000)×100
=5.27%
Interpretation of Results
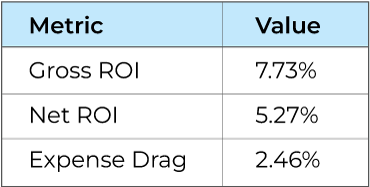
The “expense drag” reduces gross yield by approximately 2.5 percentage points, consistent with stabilized mid-market Dubai residential assets.
A 5.27% net yield in a tax-free jurisdiction compares favourably to:
- London residential: 2–4% net
- Singapore prime: 2–3% net
- US Tier-1 cities: 3–5% net (pre-tax)
Advanced Considerations
1. Transaction Cost Adjustment
If we include:
- 4% DLD transfer fee
- 2% agency fee
- Trustee & admin fees
Total acquisition cost may approach ~AED 1,170,000.
Recalculating net ROI using full acquisition basis reduces yield to approximately 4.95%, which is a more institutionally accurate metric.
2. Capital Appreciation Component
ROI discussed above reflects income yield only. Total Return should include:
Total Return=Net Yield + Capital Appreciation

Al Furjan recorded steady priceappreciation over recent years due to:
- Metro connectivity
- Proximity to Expo City
- Infrastructure maturity
Even a conservative 3–5% annual capital growth significantly enhances total IRR.
Key Takeaways for Investors
- Gross ROI is a screening tool — fast but incomplete.
- Net ROI determines real profitability.
- Service charges affect Dubai apartment returns — always verify AED/sq.ft rates.
- We have to be conservative while considering Vacancy Model(minimum 5%).
- True acquisition cost must include DLD and brokerage fees.
- In Dubai’s tax-neutral framework, a 5–6% stabilized net yield is globally competitive.
- Always validate rental comps and transaction history through DLD-backed platforms such as DXB Interact before acquisition.
Conclusion:
Mr. Nilesh has a one-bedroom apartment in Al Furjan. It shows how careful ROI modeling can improve results. It can turn a simple rental into a clear financial asset. With a gross yield of 7.73% and a stabilized net yield of 5.27%, the asset performs near the top range.
It sits within Dubai’s mid-market residential sector.
In modern real estate investing, intuition is insufficient. Precision, data validation, and disciplined cost modeling define successful portfolio construction.
If you would like, you can download an Excel file to calculate ROI. You can also contact our PM Team to help optimize your ROI in Dubai’s real estate market.
FAQs


.svg)